Introduction
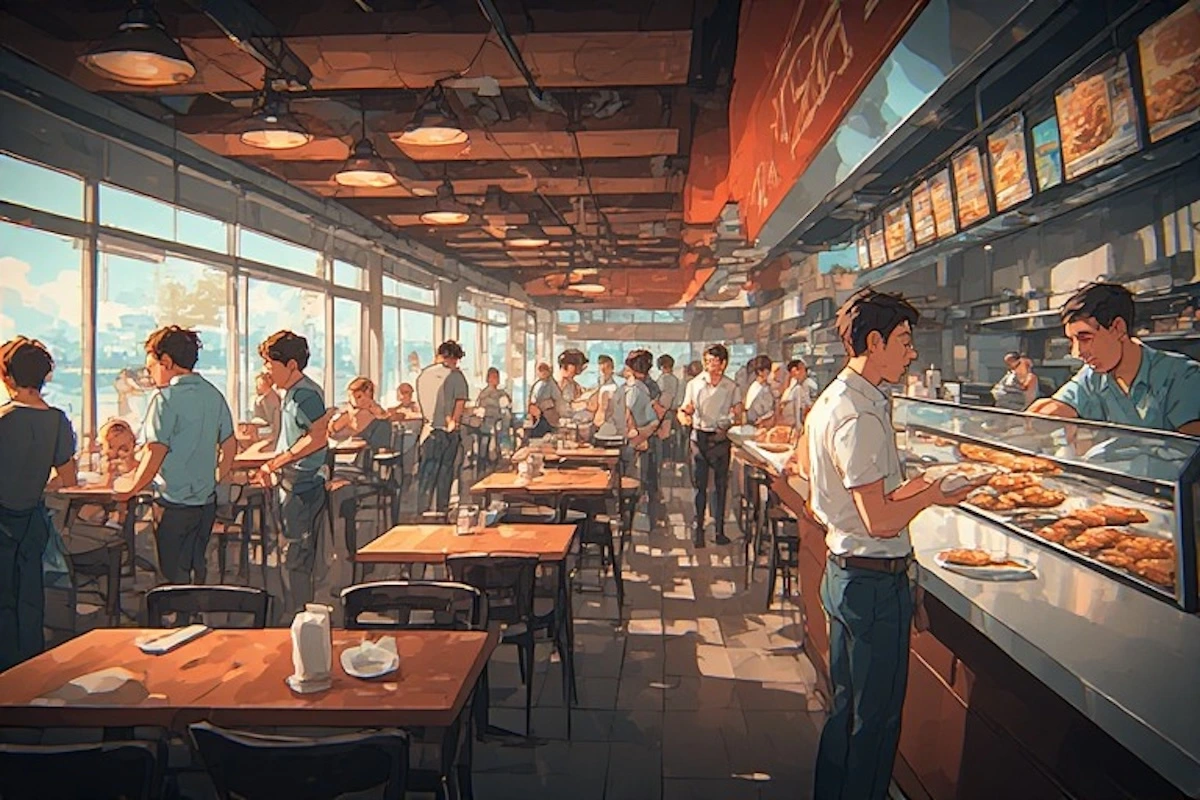
Imagine walking into a busy local restaurant during lunch hour. The aroma of freshly prepared meals fills the air, conversations bounce from table to table, and hungry customers crowd around different food counters. At first glance, the place looks lively and successful. But beneath the energy lies a hidden problem: long queues, frustrated customers, and painfully slow service.
This was exactly the situation faced by a restaurant in Ibadan, Nigeria — the focus of a fascinating research study on queue theory and service optimization. The researchers did not simply observe the chaos; they used mathematics, simulation, and operational analysis to redesign the restaurant’s customer flow without hiring extra staff.
What makes this study particularly interesting is that it demonstrates how scientific modeling can solve everyday problems. Instead of expensive renovations or increasing manpower, the researchers discovered that reorganizing existing servers dramatically reduced waiting time from more than 543 minutes to just 13.47 minutes.
This article reviews and discusses the study in a reader-friendly way, explaining how the researchers used a multistage queue model to improve restaurant efficiency and what lessons businesses can learn from it.
Understanding the Study: What Is a Multistage Queue System?
Before diving into the findings, it helps to understand the concept behind the research.
A queue system is simply a waiting line. We experience queues everywhere — banks, supermarkets, hospitals, airports, and restaurants. Queue theory is the mathematical study of these waiting lines and how they behave.
In this particular study, the researchers focused on a multistage queue system. Unlike a single waiting line, a multistage system requires customers to pass through several service points before completing their transaction.
The restaurant studied in Ibadan had three stages:
- Food Selection Stage
Customers chose among three local delicacies, each served at a different queue. - Drink Purchase Stage
After receiving food, customers moved to another queue to buy drinks. - Payment Stage
Finally, everyone joined a single payment queue.
Although the setup looked organized, bottlenecks formed because some queues were overloaded while others remained underused.
The researchers wanted to answer one key question:
Could customer waiting time be reduced simply by rearranging service operations?
Methodology: Turning Restaurant Chaos into Mathematical Data
The study used a combination of mathematical modeling and computer simulation.
The M/M/1 Queue Model
The researchers assumed the restaurant followed an M/M/1 queue system, a popular model in operations research where:
- Customer arrivals happen randomly
- Service times vary randomly
- Each queue has one server
This model helped the researchers calculate important performance indicators such as:
- Average waiting time
- Queue length
- Server utilization
- Total time spent in the system
To collect data, the team observed the restaurant over five days. They recorded:
- Customer arrival times
- Service start times
- Service completion times
- Traffic flow through each stage
These measurements allowed them to build a realistic simulation of the restaurant environment.
Discussion of the Study
The Real Problem Was Hidden in the Flow
One of the most revealing parts of the study was the discovery that the issue was not simply “too many customers.” Instead, the real problem came from uneven workload distribution.
Some food counters were extremely busy, while others had relatively short lines. The payment counter became the biggest bottleneck because every customer eventually had to pass through it.
This finding reflects a common mistake in service businesses:
Managers often assume delays require more workers, when in reality the process itself may be inefficient.
The study showed how queue theory can uncover hidden inefficiencies that are difficult to notice with casual observation alone.
Key Findings of the Research
1. Server Utilization Was Extremely High
The utilization rate of servers ranged between 70% and 97%.
A utilization rate close to 100% means a server is almost always busy, leaving little room to handle sudden surges in demand.
The queue serving the most popular local delicacy had a utilization factor of 97%, making it the primary source of congestion.
This explained why customers experienced excessive delays at that station.
2. Customers Spent an Unreasonable Amount of Time in the System
Initially, the average time customers spent in the entire restaurant system reached:
543.02 minutes
That is more than nine hours.
While this figure likely reflected severe queue accumulation during simulation conditions, it highlighted how poorly optimized the service structure had become.
The payment counter alone generated an average queue time of 511 minutes, making it the biggest operational bottleneck.
3. Simulation Became the Game Changer
Instead of immediately recommending new hires, the researchers used discrete-event simulation software called SIMUL8.
This software visually recreated customer movement through the restaurant and allowed the team to test “what-if” scenarios.
The researchers experimented with rearranging existing staff:
- A server from the least busy food station was reassigned to the overloaded payment section.
- Another configuration redistributed staff among food queues.
The result was remarkable.
4. Waiting Time Dropped Dramatically
After optimizing server allocation, the average customer time in the system dropped from:
543.02 minutes → 13.47 minutes
Even more impressive:
- The busiest food queue achieved nearly zero waiting time
- Payment delays were almost eliminated
- No additional employees were hired
This demonstrates the power of operational redesign over costly expansion.
Why This Study Matters in the Real World
At first glance, the research may seem like a technical exercise in mathematics. But its implications reach far beyond one Nigerian restaurant.
Businesses Everywhere Face Queue Problems
Restaurants, hospitals, airports, government offices, and customer service centers all struggle with congestion.
The study proves that:
- Data analysis can reveal hidden inefficiencies
- Better system design can outperform expensive upgrades
- Simulation tools help managers test solutions before implementation
In developing economies especially, where budgets are limited, this approach offers a practical way to improve customer satisfaction without major financial investment.
Simplifying the Technical Concepts
For general readers, the mathematics behind queue theory can feel intimidating. But the core idea is surprisingly simple.
Imagine a supermarket with five checkout counters.
- If everyone chooses one counter, the line becomes painfully long.
- If customers distribute evenly, service becomes faster.
Now imagine that after checkout, every customer must pass through one final security desk. Even if checkout lines are efficient, the security desk can still create massive delays.
That is exactly what happened in the restaurant study.
Queue theory helps businesses identify where these “traffic jams” occur and how to redesign the flow.
Strengths of the Study
The research stands out for several reasons.
Practical Application
The study was grounded in a real operational problem rather than theoretical assumptions alone.
Combination of Mathematics and Simulation
Using both analytical formulas and computer simulation made the findings more reliable and realistic.
Cost-Effective Solutions
One of the strongest contributions of the research is showing that dramatic improvements can occur without hiring more staff or expanding facilities.
Limitations of the Study
Despite its strengths, the research also had limitations.
Single Case Study
The model was tested in only one restaurant, meaning results may differ in other service environments.
Simplified Assumptions
The researchers assumed customers behaved perfectly:
- No customers left the queue
- No switching between lines
- Infinite queue capacity
In reality, human behavior is often unpredictable.
Limited Observation Period
Data were collected for only five days, which may not fully capture long-term operational variations.
Broader Academic Significance
From an academic perspective, the study contributes to operations research and service management by expanding understanding of multistage queue networks.
Most traditional queue studies focus on simple systems with one line and one server. This paper tackled a more realistic environment where:
- Multiple queues operate simultaneously
- Customers move through several stages
- Different services create uneven demand patterns
The research therefore bridges theory and practical management in a highly effective way.
Conclusion
The Nigerian restaurant study offers a powerful reminder that efficiency problems are not always solved by spending more money. Sometimes the answer lies in understanding how systems function beneath the surface.
By applying queue theory and simulation analysis, the researchers transformed a severely congested restaurant into a far more efficient operation. Waiting time dropped dramatically, customer flow improved, and all of it happened without increasing staff numbers.
More importantly, the study demonstrates how mathematical thinking can improve everyday experiences. What looked like ordinary lunch-hour chaos was actually a solvable engineering problem.
For restaurant managers, service businesses, and researchers alike, this study provides a valuable lesson:
Smart system design can often achieve what additional resources cannot.
In a world where customer patience grows shorter every year, that lesson may be more important than ever.
References:
- Gross, D., Shortle, J.F., Thompson, J.M. & Harris, C.M. (2008). Basic principles of waiting line systems (4th ed.). New Jersey: John Wiley and Sons Inc., p. 1.
- Sundarapandian, V. (2009). Mathematical foundations of probability, statistics, and queueing models. New Delhi: PHI Learning Private Ltd., pp. 686–709.
- Jackson, J.R. (1957). Interconnected waiting line systems. Operations Research, 5, 518–521.
- John, S.C. (2003). Introductory approaches to modeling and computer simulation. In Proceedings of the 2003 Winter Simulation Conference, Marietta.
- Stewart, R. (2004). Simulation: Model building and practical application. West Sussex: John Wiley and Sons Ltd., pp. 1–33.
- Roger, B., Stewart, R. & Kathy, K. (2011). Building conceptual models for discrete-event simulation. London & New York: CRC Press, Taylor & Francis Group, pp. 1–26.
- Hurrion, R.D. (1976). Interactive visual computer simulation for production planning: Design, use, and facility requirements (Doctoral dissertation). University of London, London.