
Canada’s trade surplus with the United States has narrowed by more than $12 billion in a single year. That’s not a coincidence — it’s the visible fingerprint of the tariff war between Washington and Ottawa that escalated sharply through 2025 and 2026. This piece breaks down what tariffs Donald Trump has imposed on Canada, how Canada has retaliated, and — using official trade data — exactly which sectors and how much money is actually on the line.
Key Takeaways
- Trump imposed a 50% tariff on roughly $20 billion of Canadian goods in August 2026 after trade talks collapsed; Canada retaliated with matching tariffs on over 700 U.S. products, effective September 8, 2026.
- Canada’s exports to the U.S. fell from $435.2 billion in 2024 to $404.2 billion in 2025 — a 7.1% drop, per UN Comtrade data.
- The U.S. share of Canada’s total exports fell from 76.4% (2024) to 72.6% (2025), suggesting Canada is starting to diversify away from U.S. markets.
- Canada’s merchandise trade surplus with the U.S. narrowed from about $86.7 billion (2024) to $74.4 billion (2025).
- Energy (mineral fuels), vehicles, and machinery are Canada’s three largest export categories to the U.S. and the most exposed to tariff escalation.
- In February 2026, the U.S. Supreme Court struck down some of Trump’s emergency-powers tariffs, though sector-specific tariffs on steel, aluminum, and autos remained in place.
Table of Contents
1. Timeline: How the Canada-U.S. Tariff War Escalated 2. What Tariffs Has Trump Imposed on Canada, and Why? 3. How Has Canada Retaliated? 4. Canada-U.S. Trade by the Numbers: What the Data Shows 5. Which Industries Are Most Exposed? 6. How This Affects Consumers and Businesses 7. Analysis: Who Has More to Lose? 8. What Could Happen Next? 9. FAQ
Timeline: How the Canada-U.S. Tariff War Escalated
| Date | Event |
|---|---|
| Feb 1, 2025 | Trump announces 25% tariffs on most Canadian imports and 10% on energy products; Canada announces retaliatory tariffs on $30B of U.S. goods. |
| Mar 2025 | Canadian retaliatory tariffs expand to roughly $155B of U.S. goods. |
| Aug 29, 2025 | A U.S. court of appeals rules most of Trump’s emergency tariffs are illegal. |
| Sep 1, 2025 | Canada removes most of its March 2025 counter-tariffs on U.S. imports; steel, aluminum, and auto tariffs remain. |
| Oct 23–25, 2025 | Trump halts trade talks with Canada, then declares a further 10% tariff increase. |
| Feb 20, 2026 | U.S. Supreme Court strikes down Trump’s emergency-powers tariffs on Canada. |
| Feb 24, 2026 | A new 10% tariff (raised from an initial announcement) takes effect regardless. |
| Aug 21–22, 2026 | Trade talks collapse; a 50% U.S. tariff on about $20B of Canadian goods (wine, furniture, dairy, cement, clothing, and more) takes effect at midnight. |
| Aug 23, 2026 | Canada announces matching retaliatory tariffs on U.S. steel, dairy, and electronics, effective September 8. |
| Sep 8, 2026 | Canada’s retaliatory tariffs take effect on over 700 U.S. products, ranging from 15% to 50%, including a doubling of steel and aluminum duties to 50%. |
What Tariffs Has Trump Imposed on Canada, and Why?
The Trump administration’s tariffs on Canada have layered on top of one another since February 2025: a broad tariff on most Canadian goods, a separate 10% levy on energy products, sector-specific tariffs on steel, aluminum, and autos, and — most recently — a 50% tariff targeting roughly $20 billion of Canadian goods including wine, furniture, dairy, cement, clothing, fishing rods, and hockey equipment. The administration has cited trade deficits and fentanyl trafficking as justifications, though U.S. government data shows only a small share of fentanyl entering the country comes across the Canadian border. Canadian officials have called the demands behind the collapsed August 2026 talks “uneconomic” and “unfair.”
A partial exemption has applied throughout: goods that comply with the Canada-United States-Mexico Agreement (CUSMA) have, at various points, been shielded from the broadest tariffs — though sector-specific levies on steel, aluminum, and autos apply regardless of CUSMA status.
How Has Canada Retaliated?
Canada’s response has followed a consistent “dollar-for-dollar” principle: match the value of new U.S. tariffs with equivalent counter-tariffs on U.S. goods. After the August 2026 escalation, Canada announced retaliatory tariffs on more than 700 U.S. products worth roughly $20 billion, ranging from 15% to 50%, alongside a $7.5 billion support package for Canadian businesses and workers affected by the trade war. Notably, Canada doubled its own duties on U.S. steel and aluminum to 50% — matching the rate the U.S. had already imposed on Canadian metals.
Canada-U.S. Trade by the Numbers: What the Data Shows
The chart below tracks three flows using UN Comtrade merchandise trade data from 2016 through 2025: Canada’s exports to the U.S., Canada’s exports to the rest of the world, and U.S. exports to Canada. All three flows grew strongly after the 2020 pandemic dip and peaked in 2022 — but 2025 marks the first sustained decline in the series that isn’t explained by a global shock like COVID-19.
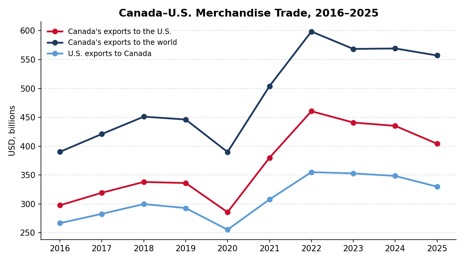
Figure 1. Canada–U.S. merchandise trade, 2016–2025 (USD billions). Source: UN Comtrade.
The headline numbers
| Metric | 2024 | 2025 | Change |
|---|---|---|---|
| Canada’s exports to the U.S. | $435.2B | $404.2B | −7.1% |
| Canada’s exports to the world | $569.2B | $557.1B | −2.1% |
| U.S. exports to Canada | $348.5B | $329.8B | −5.4% |
| Canada’s imports from the world | $554.3B | $563.9B | +1.7% |
| U.S. share of Canada’s exports | 76.4% | 72.6% | −3.9 pts |
| U.S. share of Canada’s imports* | 62.9% | 58.5% | −4.4 pts |
| Canada’s trade surplus with the U.S.** | $86.7B | $74.4B | −14.1% |
* Estimated using U.S.-reported exports to Canada as a share of Canada’s total imports from the world. ** Calculated as Canada’s exports to the U.S. minus U.S. exports to Canada, both from national trade-reporting data; mirror-statistics gaps mean this figure is directionally reliable rather than exact.
* Estimated using U.S.-reported exports to Canada as a share of Canada’s total imports from the world. ** Calculated as Canada’s exports to the U.S. minus U.S. exports to Canada, both from national trade-reporting data; mirror-statistics gaps mean this figure is directionally reliable rather than exact.
Three things stand out. First, Canada’s exports to the U.S. dropped faster than its exports to the rest of the world (−7.1% vs. −2.1%), which is the clearest sign the tariffs — not a broader slowdown — are driving the decline. Second, Canada’s overall imports from the world actually rose (+1.7%) even as imports specifically from the U.S. fell (−5.4%), meaning Canadian buyers appear to be sourcing more from non-U.S. suppliers rather than simply buying less. Third, the U.S. share of both Canada’s exports and imports fell by roughly 4 percentage points in a single year — a meaningfully fast pace of diversification for an economy this size.
Which Industries Are Most Exposed?
Canada’s exports to the U.S. are heavily concentrated in a handful of sectors, which is exactly why sector-specific tariffs (steel, aluminum, autos, energy) carry outsized weight. The chart below shows Canada’s eight largest export categories to the U.S. in 2025.
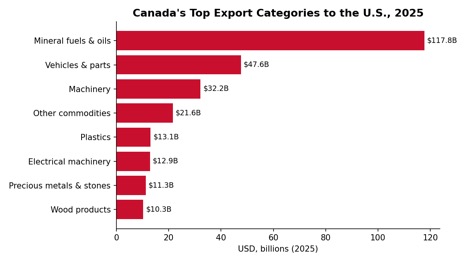
Figure 2. Canada’s largest export categories to the U.S., 2025 (USD billions). Source: UN Comtrade.
Top Canadian exports to the U.S. (2025)
| Product category | 2025 value | YoY change |
|---|---|---|
| Mineral fuels & oils | $117.8B | −9.1% |
| Vehicles & parts | $47.6B | −9.9% |
| Machinery | $32.2B | −0.5% |
| Other commodities | $21.6B | +9.8% |
| Plastics | $13.1B | −10.1% |
| Electrical machinery | $12.9B | −5.5% |
| Precious metals & stones | $11.3B | +11.5% |
| Wood products | $10.3B | −12.1% |
| Aluminium & articles | $9.8B | −15.7% |
Aluminium stands out as the hardest-hit major category, down nearly 16% year-over-year — consistent with the sector-specific 50% tariff both governments have applied to metals. Wood products and plastics also posted double-digit declines, while “other commodities” and precious metals were among the few categories that grew.
Top U.S. exports to Canada (2025)
| Product category | 2025 value | YoY change |
|---|---|---|
| Machinery | $51.3B | −0.0% |
| Vehicles & parts | $46.3B | −13.7% |
| Electrical machinery | $27.6B | −2.3% |
| Mineral fuels & oils | $27.0B | +2.4% |
| Other commodities | $15.4B | −36.6% |
| Plastics | $14.3B | −5.1% |
| Precision instruments | $10.8B | −0.1% |
| Aircraft & parts | $9.2B | +11.3% |
| Pharmaceuticals | $7.0B | +2.6% |
U.S. vehicle exports to Canada fell even more sharply (−13.7%) than Canadian vehicle exports to the U.S. (−9.9%), reflecting how deeply integrated — and mutually exposed — North American auto supply chains are to tariffs on both sides of the border.
How This Affects Consumers and Businesses
Tariffs function as a tax paid at the border, and that cost tends to flow through to buyers on both sides. In the U.S., analysts have linked the tariffs to a broader rise in the cost of living, with consumer prices up over 3% year-over-year and energy costs climbing as tariff-related supply adjustments ripple through. In Canada, officials have been candid that retaliatory tariffs “will raise costs and reduce choice for Canadians,” even as they frame the measures as necessary to protect domestic manufacturing, particularly in steel and aluminum. Businesses on both sides of the border — especially in the deeply integrated auto sector — have cited planning uncertainty as a cost in itself, independent of the tariffs’ direct price impact.
Who Has More to Lose?
The trade data suggests an asymmetric but shared exposure. Canada sends a much larger share of its total exports to the U.S. (72.6%) than the U.S. sends to Canada as a share of its own exports — meaning a disruption in this relationship is structurally more consequential for Canada’s overall economy than for the United States’. That’s the traditional argument for why the U.S. holds more leverage in the relationship.
But the 2025 data complicates that picture in two ways. First, the decline in Canadian exports to the U.S. (−7.1%) was steeper than the decline in U.S. exports to Canada (−5.4%) — yet Canada’s total exports to the world barely slowed (−2.1%), implying Canadian exporters are finding alternative buyers faster than U.S. exporters are finding alternatives to Canada. Second, in the sectors where the two economies are most interlinked — autos and machinery — the U.S. side actually contracted more than the Canadian side in dollar terms for vehicles (−13.7% vs. −9.9%), a reminder that integrated supply chains cut both ways: a tariff aimed at protecting one country’s auto sector can just as easily shrink its own exports of the same product.
The clearest net effect visible in the numbers isn’t a clean win for either government — it’s a shrinking pie. Total two-way trade between the two countries fell from roughly $783.7 billion in 2024 to $734.0 billion in 2025, a 6.3% contraction in the size of one of the world’s largest bilateral trading relationships.
What Could Happen Next?
Several open threads will shape where this goes from here. The Supreme Court’s February 2026 ruling against Trump’s use of emergency powers for tariffs leaves the administration relying more heavily on sector-specific authorities (like those covering steel, aluminum, and autos), which are on firmer legal footing but narrower in scope. CUSMA itself is due for review, and how that process unfolds could either formalize the current tariff regime or roll parts of it back. In the meantime, Canada has signaled it’s prepared to hold its retaliatory tariffs in place — and both the boycott movement among Canadian consumers and the diversification trend visible in the trade data suggest some of the shift away from U.S. trade may outlast the dispute itself, even if a deal is eventually reached.
FAQ
What tariff rate is the U.S. currently charging on Canadian goods?
Rates vary by product and have changed repeatedly since February 2025. The most recent major escalation, in August 2026, applied a 50% tariff to about $20 billion of Canadian goods, on top of earlier tariffs and sector-specific duties on steel, aluminum, and autos.
Is CUSMA still in effect?
Yes, but its protections have been inconsistently applied. CUSMA-compliant goods have, at various points, been exempted from the broadest tariffs, while sector-specific tariffs on steel, aluminum, and autos have applied regardless of CUSMA status.
Why did the Supreme Court strike down some of Trump’s tariffs?
In February 2026, the U.S. Supreme Court ruled that the President could not use emergency economic powers under the International Emergency Economic Powers Act to impose certain tariffs, which cleared the way for some — but not all — of the 2025 tariffs to be reversed.
Which Canadian exports are most affected by the tariffs?
Based on 2025 trade data, aluminum, wood products, and plastics saw the steepest year-over-year declines among Canada’s major export categories to the U.S., while energy and vehicles — Canada’s two largest export categories — also declined, though somewhat less sharply.
Is Canada’s trade surplus with the U.S. shrinking?
Yes. Based on national trade data, Canada’s merchandise trade surplus with the U.S. narrowed from roughly $86.7 billion in 2024 to about $74.4 billion in 2025.
The Bottom Line
The Canada-U.S. tariff war isn’t a one-sided story of who’s “winning” — the trade data shows both countries’ exports to each other shrinking, even as Canada’s exports to the rest of the world hold up comparatively well. Whatever happens with CUSMA’s review or the next round of talks, the diversification already visible in 2025’s numbers may prove more durable than the tariffs that triggered it.