The Candy Bar That Got Smaller Without Anyone Announcing It
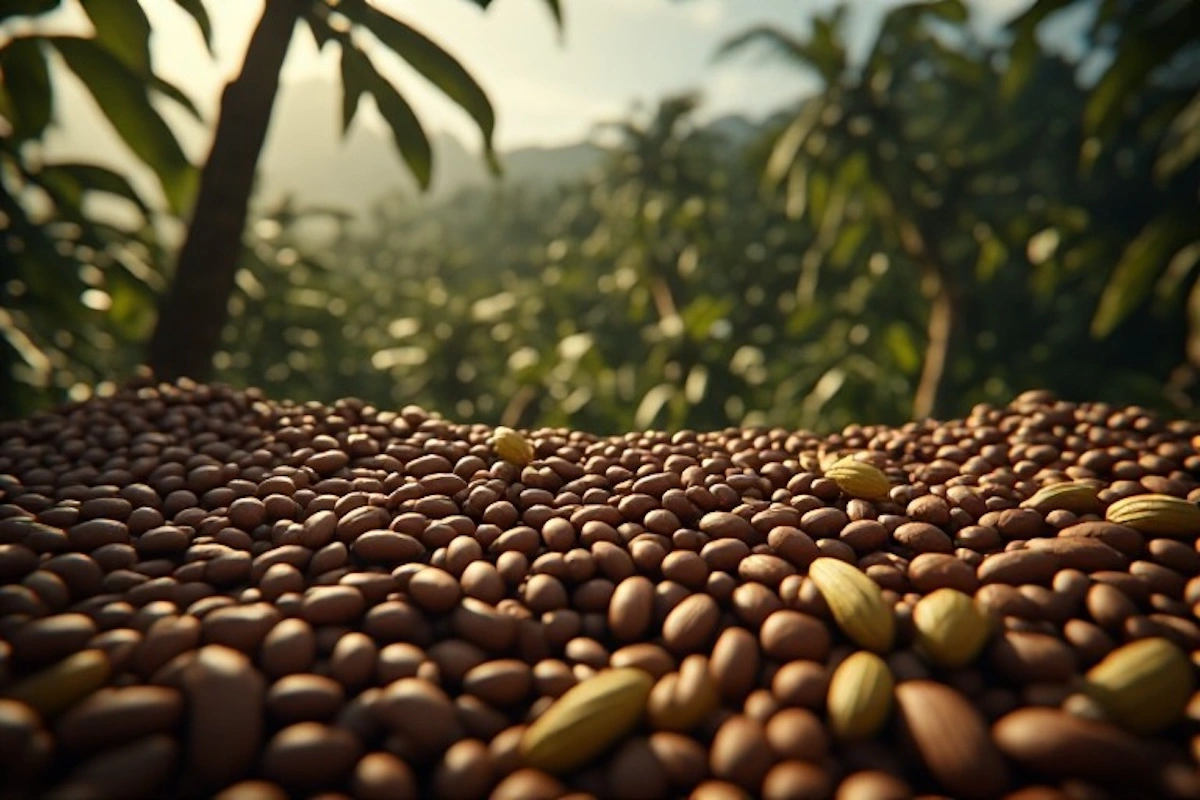
Somewhere between April 2026 and your last trip to the store, the standard Mars bar quietly shrank from 1.8 ounces to 1.41 ounces, roughly a 22% reduction, with the price tag largely unchanged. It’s not an isolated incident. Chocolate makers including Lindt & Sprüngli, Mondelez, and ingredient supplier Barry Callebaut have been swapping cocoa butter for shea butter and palm oil, and quietly blending in cocoa alternatives made from yeast extract or roasted grape and sunflower seeds.
It’s easy to blame this on generic “corporate greed,” and it’s a satisfying story. It’s also missing the actual cause. The real driver of your shrinking candy bar, and a surprising amount of everything else rising in price at the grocery store, traces back thousands of miles to a specific, measurable phenomenon in the Pacific Ocean: El Niño. Understanding how it works, and why the next one is expected to be the strongest in over 150 years, explains a lot more about your grocery bill than any political narrative currently circulating.
What El Niño Actually Is, Briefly
El Niño is a recurring climate pattern defined by unusually warm sea surface temperatures in the tropical Pacific Ocean. It disrupts normal rainfall patterns worldwide, triggering droughts in some regions and flooding in others, and its effects on agriculture, shipping, and energy production can last up to three years after the event itself has technically ended.
The 2023-24 El Niño, classified as strong, was significant enough to be one of the major factors behind 2024 becoming the hottest year on record. The next one, according to the National Oceanic and Atmospheric Administration, is expected to be considerably more severe, a so-called Super El Niño, projected to be the strongest in roughly 150 years, forecast to begin in the summer of 2026 and continue through February 2027. Some scientists have gone further, raising concern that the planet may be shifting toward a near-permanent El Niño state as ocean warming continues to intensify.
How This Actually Reaches Your Grocery Cart
The Chocolate Squeeze
Cocoa futures surged more than 150% between June 2023 and late 2024 during the last El Niño, at one point approaching $12,000 per metric ton, a price increase comparable to silver suddenly quintupling in value within a year. Cocoa prices have since fallen roughly 70% from that peak. Chocolate prices at the shelf, however, haven’t followed that decline anywhere close to proportionally.
That gap is exactly why shrinkflation and skimpflation, reducing package sizes or substituting cheaper ingredients while holding the price steady, have become standard practice across the confectionery industry. Manufacturers absorbed as much of the original cocoa spike as they reasonably could without dramatically raising sticker prices, and much of that absorption came in the form of a smaller bar or a less chocolate-heavy recipe rather than a visible price increase. With a new, stronger El Niño already forecast, there’s little reason to expect this trend to reverse; if anything, the mechanism that produced the smaller Mars bar is about to be tested again, harder.
The Rice Shock
Chocolate isn’t the only casualty. India supplies roughly 40% of the world’s rice exports, and more than 40 countries depend on India for over half of their rice imports. In July 2023, as El Niño-driven conditions threatened its own domestic supply, India abruptly banned exports of non-basmati rice, a category representing about 25% of its total rice exports. The ban lasted approximately 14 months. During that window, India’s total rice exports fell by 34%, and non-basmati white rice exports specifically collapsed by 88%, a reduction roughly equivalent to emptying every bag of rice from every major retailer’s shelves across the country it was exported to.
The ripple effects were immediate. Countries scrambled for alternative suppliers, but Thailand and Vietnam, two of the other largest rice exporters, were dealing with their own El Niño-driven disruptions. By February 2024, benchmark Thai rice prices had jumped 22%, reaching levels not seen in 15 years. Welfare losses across sub-Saharan Africa alone, a region heavily reliant on rice imports, have been estimated at roughly $353 million as a direct consequence of India’s export ban. Prices have since eased as supply normalized, but the underlying lesson is durable: when a major food-exporting country’s domestic supply is threatened, it will restrict exports to protect itself first, and the resulting shock lands hardest on the countries that can least absorb it.
The Shipping Chokepoint You’ve Probably Never Thought About
Rising ingredient costs are only part of the story. El Niño-driven droughts also disrupt the physical infrastructure that moves food around the world, and nowhere illustrates that more clearly than the Panama Canal.
The 51-mile canal is the single most critical chokepoint for US agricultural trade, carrying an estimated 14% to 17% of all US agricultural exports by volume and roughly 40% of all US container traffic, including large volumes of inbound fruits, vegetables, raw ingredients like cocoa, and processed foods. Each ship transiting the canal requires the equivalent of about 76 Olympic-sized swimming pools of fresh water, drawn primarily from Gatun Lake.
During the 2023-24 El Niño, drought conditions caused Gatun Lake’s water levels to drop sharply, forcing the Panama Canal Authority to cut daily transit slots well below the normal range of 36 to 38 ships. At the peak of the resulting backlog, in August 2024, more than 160 ships were queued waiting to transit. Some shipping companies abandoned the wait entirely, rerouting around the Cape of Good Hope or through the Suez Canal instead, adding thousands of miles and significant cost to their journeys. Others bid up to $4 million to secure a transit slot vacated by a departing ship, more than 20 times the normal rate. The resulting bottleneck stranded enough cargo, by one estimate, to fill a line of semi-trucks stretching from New York to London.
The disruption wasn’t limited to the canal itself. That same drought caused the Amazon River and its tributaries, including the Rio Negro, to hit record lows. By October 2024, the Rio Negro had fallen to its shallowest recorded depth since measurements began in 1902, stranding cargo boats and ferries and cutting off hundreds of thousands of people across Brazil, Peru, and Colombia from normal transport.
The Hidden Cost Almost Nobody Talks About: Insurance
There’s a further, less visible mechanism through which El Niño reaches consumer prices, and it doesn’t show up directly on a grocery receipt at all: insurance. A Super El Niño is capable of triggering flood losses in one region, drought-driven agricultural claims in another, and elevated wildfire risk elsewhere, essentially simultaneously. That kind of widespread, correlated risk is precisely what traditional insurance and reinsurance risk models struggle to price accurately, since they’re generally built around the assumption that major claims across different regions and disaster types won’t all spike at once.
When that assumption breaks down, reinsurance capital gets depleted faster than expected, and insurers respond by raising premiums broadly, not just in the specific regions directly affected. In the US specifically, this is compounded by the fact that many properties in flood-prone areas remain structurally underinsured, since standard homeowners’ insurance policies typically exclude flood coverage entirely. The end result is a slow, largely invisible inflationary pressure: higher insurance costs get built into the price of nearly everything, from the cost of running a farm or a shipping company to the price of a home, and those costs are ultimately passed along to consumers alongside the more visible grocery price increases.
Why This Keeps Happening Even When El Niño Underperforms
One counterintuitive detail from the 2023-24 event is worth understanding, because it shows just how unpredictable these disruptions can be. The atmospheric mechanism behind El Niño’s global effects is a wind pattern called the Walker Circulation, an east-west atmospheric flow above the Pacific that normally helps regulate rainfall distribution across the tropics. During El Niño, this circulation typically weakens, which is what drives the drought-and-flood imbalance responsible for the disruptions described above.
During the 2023-24 event, unusual warmth in the Indian and Atlantic Oceans partially offset the weakening of the Walker Circulation, meaning the atmospheric disruption was actually milder than forecasters initially expected. Even so, the practical consequences were still severe and, in some cases, the opposite of what was predicted. Meteorologists had expected a wetter winter to finally ease a persistent drought across the southern US, including California; it never fully materialized. They also expected El Niño’s usual dampening effect on Atlantic hurricane activity; instead, the 2023 hurricane season turned out to be the fourth most active on record. Seasonal forecasting models built on historical El Niño patterns became notably less reliable as a result.
The broader mechanism connecting a warm patch of the Pacific to weather thousands of miles away runs through what meteorologists call teleconnections, large-scale atmospheric pressure and circulation patterns that link climate anomalies across vast distances, often via shifts in the jet stream driven by Rossby waves. These effects can weaken the polar vortex, contributing to colder European winters, while simultaneously driving extreme heat in places like Africa’s Sahel region. The practical takeaway is that even a weaker or less predictable El Niño doesn’t mean a safer one; it can simply mean a more erratic and harder-to-forecast set of disruptions, which is arguably worse for supply chains and insurers that depend on predictability to manage risk.
The Numbers Behind the Story
- 150%+ rise in cocoa futures between June 2023 and late 2024, peaking near $12,000 per metric ton
- 22% reduction in the standard Mars bar’s weight as of April 2026
- 40% of global rice exports supplied by India; 34% drop in India’s total rice exports during its 2023-24 export ban
- 160+ ships queued at the Panama Canal at the peak of the 2024 backlog, with transit slot prices bid up to $4 million, over 20 times the normal rate
- 41.5 feet: the record-low depth reached by the Rio Negro in October 2024, the shallowest since 1902
- ~150 years: how far back forecasters are looking to find a comparably strong El Niño to the one expected in 2026-2027
What This Means for Anyone Watching Their Grocery Bill
The practical implication isn’t that any single price increase can be blamed entirely on El Niño, plenty of other factors genuinely do affect food and goods prices. But treating rising grocery costs as purely a story about corporate pricing decisions or domestic economic policy misses a structural, physical driver that’s measurable, recurring, and, based on current forecasting, about to intensify. Shrinking candy bars, pricier rice, costlier shipping, and rising insurance premiums aren’t four unrelated stories. They’re four visible symptoms of the same underlying cause, and understanding that connection is useful both for making sense of your own receipts and for setting realistic expectations about where prices are likely headed as the next, stronger El Niño arrives.
Where This Analysis Has Limits
A few caveats are worth acknowledging directly. First, El Niño is one significant contributor to global food and shipping price pressure, not the only one; labor costs, energy prices, tariffs, and company-specific business decisions all play a role too, and isolating El Niño’s precise share of any single price increase is genuinely difficult. Second, forecasting the exact strength and timing of a Super El Niño remains an inexact science, as demonstrated by how differently the 2023-24 event unfolded compared to initial expectations; the 2026-2027 event could similarly diverge from current projections in either direction. Third, some of the specific figures here, particularly longer-term welfare loss estimates and projected severity comparisons to historical events, involve modeling and estimation rather than direct, universally agreed-upon measurement, and should be read as credible estimates rather than precise, undisputed facts.
Frequently Asked Questions
Why is chocolate more expensive and smaller than it used to be?
Cocoa prices spiked more than 150% during the 2023-24 El Niño due to drought and disease affecting major growing regions. Rather than fully passing that cost onto consumers through higher prices, many manufacturers reduced package sizes (shrinkflation) or substituted cheaper ingredients (skimpflation) instead.
What is a Super El Niño, and when is the next one expected?
A Super El Niño is an unusually strong version of the recurring El Niño climate pattern. The National Oceanic and Atmospheric Administration has projected the next one to be the strongest in roughly 150 years, expected to begin in summer 2026 and continue through February 2027.
How does a drought in the Pacific Ocean affect shipping costs?
El Niño-driven droughts can lower water levels in critical waterways like the Panama Canal, forcing authorities to reduce the number of daily ship transits. This creates shipping backlogs, forces some vessels to take longer, more expensive alternate routes, and drives up costs that eventually pass through the supply chain to consumers.