
If you’ve ever seen survey results like “This poll has a margin of error of ±3%” and wondered what that means or, how to calculate it, you’re not alone. Understanding margin of error is essential for interpreting data correctly, especially in statistics, surveys, and scientific research
In this guide, we’ll explain what the margin of error is, why it matters, and how anyone can calculate it even without a math degree. Let’s break it down in simple terms.
🔍 What Is the Margin of Error?
The margin of error (MOE) is a statistic that tells you how much the results of a survey or study might differ from the true value for the entire population.
It represents a range above and below the sample result to account for possible errors in sampling. The smaller the margin of error, the more accurate the results are.
Example:
If a survey says 60% of people like coffee with a margin of error of ±3%, the real percentage of coffee lovers in the population is likely between 57% and 63%.
🧠 Why Is Margin of Error Important?
- Measures accuracy: It tells how close your sample is to the actual population.
- Builds trust: It helps people understand the uncertainty behind numbers.
- Guides decisions: Businesses, governments, and researchers use it to make informed choices.
📏 Formula to Calculate Margin of Error
There are different formulas depending on the situation, but the basic formula for margin of error (MOE) for a population proportion is:
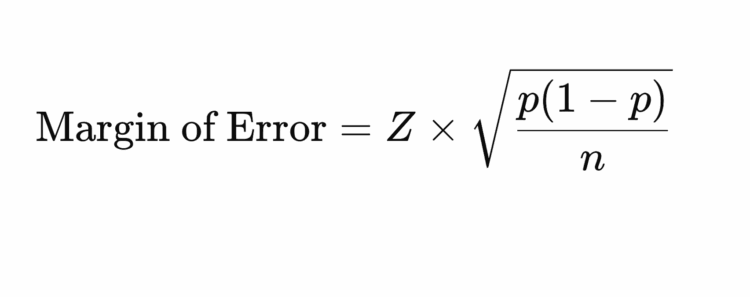
Where:
- Z = Z-score (based on confidence level)
- p = sample proportion (decimal form, e.g. 0.5 for 50%)
- n = sample size
🧮 Step-by-Step: How to Calculate Margin of Error
✅ Step 1: Choose a Confidence Level
Common confidence levels:
- 90% → Z = 1.645
- 95% → Z = 1.96 (most common)
- 99% → Z = 2.576
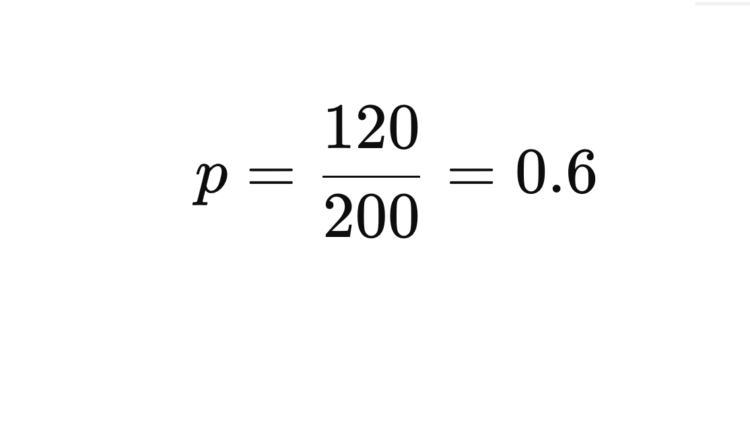
✅ Step 2: Find the Sample Proportion (p)
The sample proportion is the percentage of people who gave a certain response, expressed as a decimal.
Example: If 120 out of 200 people say “yes”, p=120200=0.6p = \frac{120}{200} = 0.6
✅ Step 3: Plug the Values into the Formula
Let’s say:
- p = 0.6
- n = 200
- Confidence level = 95% → Z = 1.96
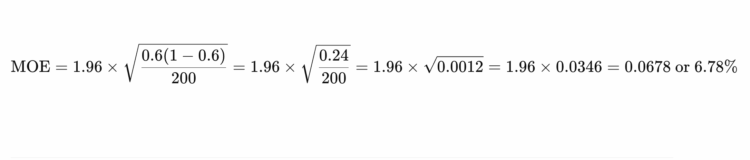
So, the margin of error is ±6.78%
✨ What Affects the Margin of Error?
| Factor | Effect |
|---|---|
| Sample Size (n) | Larger samples = smaller MOE |
| Confidence Level | Higher confidence = larger MOE |
| Population Variability (p) | More variability = higher MOE |
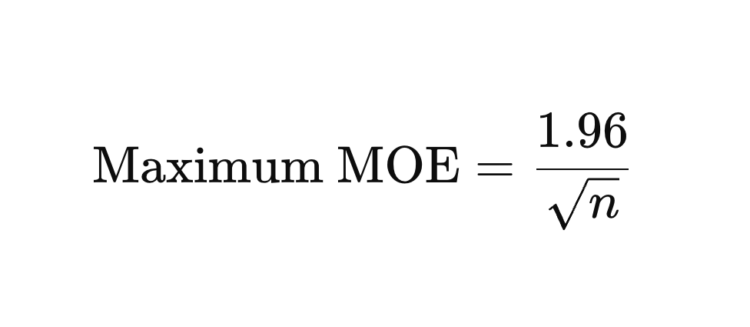
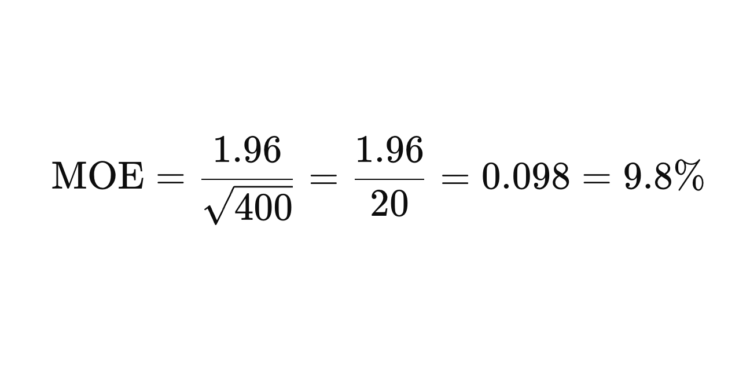
📊 Shortcut for Maximum Margin of Error
When you don’t know the sample proportion (p), use p = 0.5 (most conservative estimate), because it gives the maximum possible margin of error.
Quick formula (for 95% confidence):
Example:
For n = 400:
🧾 Real-World Examples
1. Poll Results
“55% of voters support Candidate A. Margin of Error: ±4%”
Interpretation: True support is likely between 51% and 59%
2. Customer Satisfaction Survey
“80% of customers are satisfied. Margin of Error: ±2%”
Interpretation: Real satisfaction rate is likely between 78% and 82%
✅ Tips for Interpreting Margin of Error
- Smaller MOE is better – it means your data is more precise.
- Always check sample size – a survey with 1,000 people is more reliable than one with 100.
- Overlap matters – if two candidates’ support percentages overlap within MOE, the race is too close to call.
❓ Common Questions
🔹 Is margin of error the same as standard error?
Not exactly. The standard error is part of the formula for the margin of error. MOE is the range, while SE is the standard deviation of your sample estimate.
🔹 What if I have a known population size?
If your population is small, you can apply a finite population correction (FPC) to get a more accurate MOE. But for large populations (over 20,000), this is usually unnecessary.
🧠 Final Thoughts
The margin of error helps you understand how much confidence you can have in survey or poll results. While the math might seem intimidating at first, it’s easy to grasp with a little practice.
Whether you’re a student, a business owner, or just someone curious about the news, knowing how to calculate and interpret margin of error gives you a big advantage in understanding data.